Go to help
Explore gene expression
The main page of the expression viewer tool (Figure 1) allows the user to choose between all available datasets and provide a list of genes to compare their expression values in multiple visualization tools. The datasets information can be consulted in the Datasets link in the menu toolbar or in the Dataset information link in the Gene Expression Atlas input page. The input form assists users to autocomplete gene names and add them to the input gene list. Additionally, multiple gene names can be pasted into the box by the user. Clicking on the Get Expression button will return the expression output for those genes.
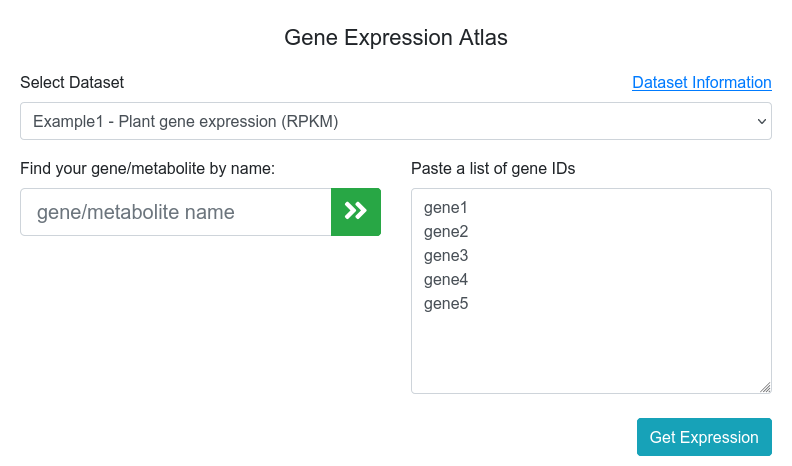
Figure 1. Expression viewer main page.
The expression viewer results provide a description of the experimental conditions of the selected dataset and five visualization methods:
- 1.1 Lines.
- 1.2 Expression cards.
- 1.3 Heatmap.
- 1.4 Replicates.
- 1.5 Average values.
1.1 Lines visualization
This output allows to compare the expression of all genes (Figure 2). In cases where the expression values and lines of some genes hide the information of others, it is possible to place the cursor over the gene names of the legend on top of the graph to highlight the selected gene. It is also possible to click on these gene names to show and hide the data in the graph (Figure 3). On the other hand, moving the cursor over the data points will show the values of all genes in the experimental sample selected. Additionally, the graph can be downloaded in different formats (SVG, CSV or PNG) to save an image of the plot or its data.
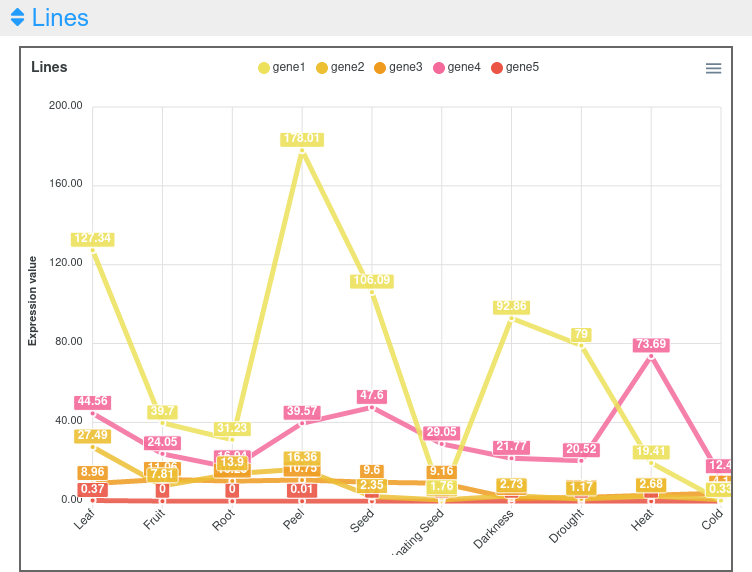
Figure 2. Expression viewer lines plot.
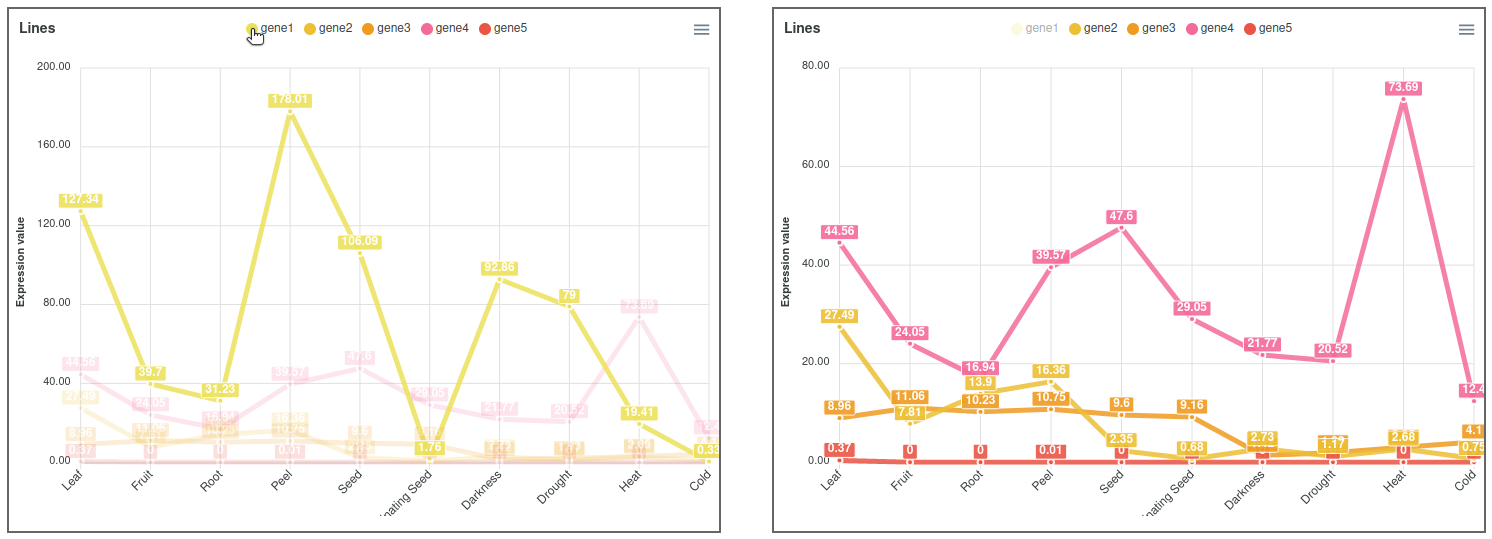
Figure 3. Expression viewer lines plot highlighting and hiding gene1.
1.2 Expression cards
In this output, the user can select each one of the genes to see their expression values together with pictures showing their phenotype in the experimental conditions or drawings representing the tissue (Figure 4). The highest value is highlighted in a golden card and the lowest ones in black cards.
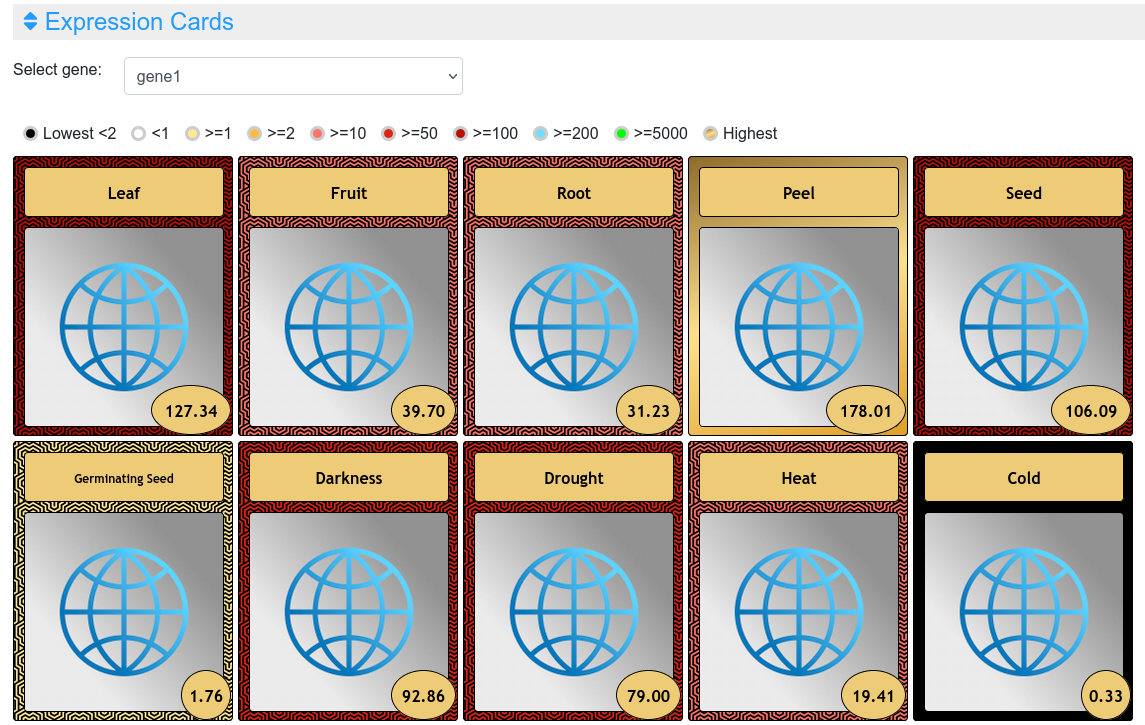
Figure 4. Expression cards in the expression viewer.
1.3 Heatmap
This output allows a simultaneous comparison of all genes and experimental conditions using a color scale that separates expression values in different ranges (Figure 5). Moving the cursor over the different color ranges in the legend will highlight the expression values within that range (Figure 6). Three different color palettes are available. Additionally, the graph can be downloaded in different formats (SVG, CSV or PNG) to save an image of the plot or its data.
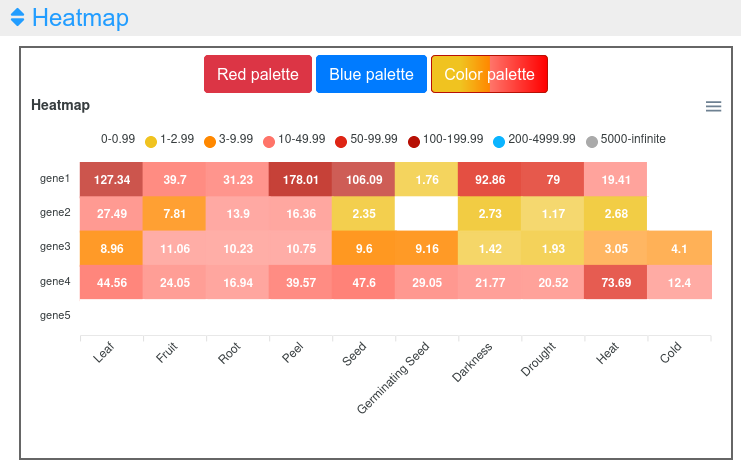
Figure 5. Heatmap visualization of the expression viewer.
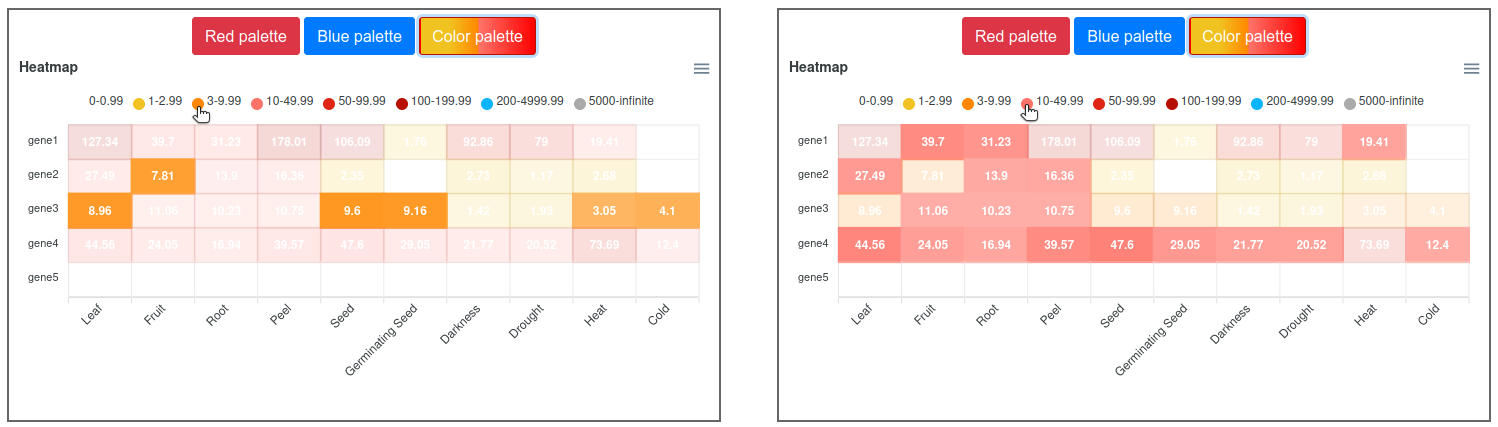
Figure 6. Heatmap visualization of the expression viewer highlighting two ranges.
1.4 Replicates
This output allows the inspection of the replicates of the selected gene (Figure 7). Moving the cursor over the data points will show the value of that replicate in the tissue selected. The graph can be downloaded in different formats (SVG or PNG) to save an image of the plot.
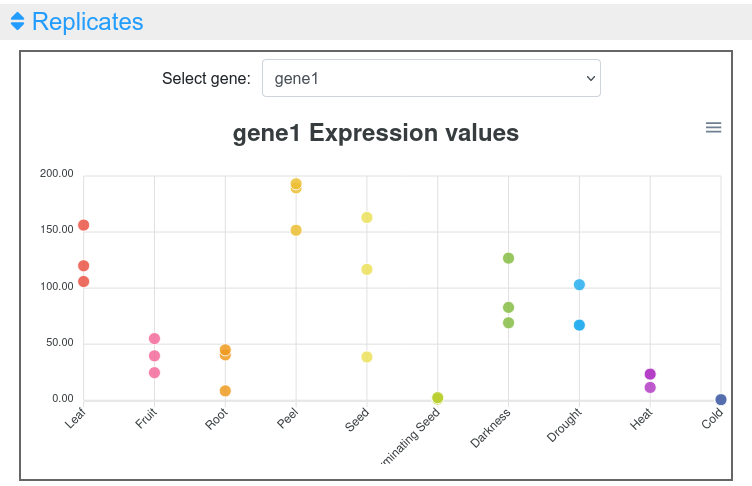
Figure 7. Expression values of replicates in the expression viewer tool.
1.5 Average values
This last output provides a table with the values of each gene in each experiment (Figure 8). This table can be downloaded in several formats (CSV, Excel, PDF), can be copied to the clipboard, filtering out unwanted columns and searching within the information in the table.
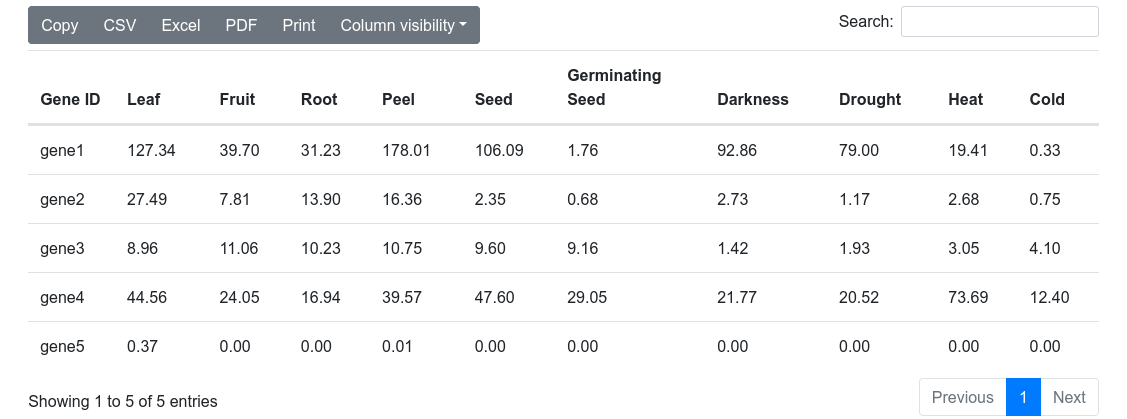
Figure 8. Average values table in the expression viewer tool.