Go to help
Expression Comparator
The expression comparator tool (Figure 1) allows the user to provide a list of genes to compare their expression values between multiple samples along all available datasets. The datasets information can be consulted at the Datasets tab. The input form assists users to autocomplete gene names and add them either to the query gene or to the fold change calculator list. Additionally, multiple gene names can be pasted into the boxes by the user. Clicking on the Compare button will return the output for those genes.
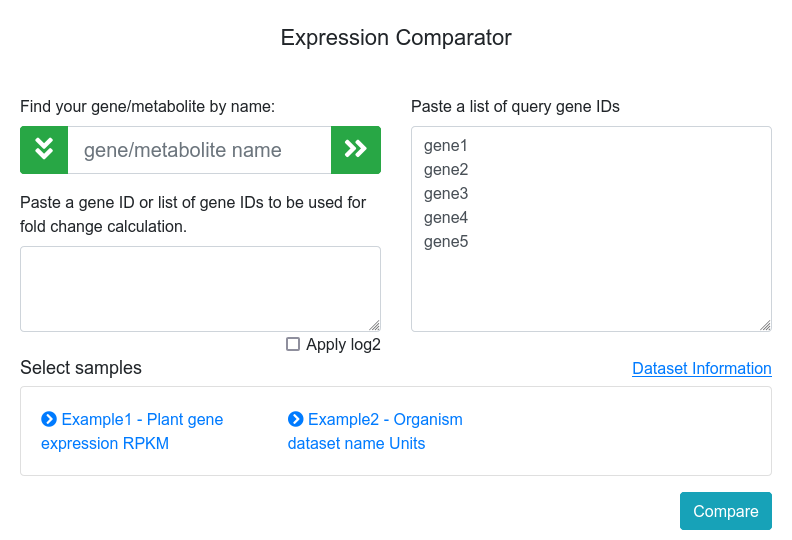
Figure 1. Expression comparator main page.
There are two ways to look for gene comparison:
2.1 With fold change calculation.
The user can specify a gene ID or a list of gene IDs - housekeeping genes, for example - to be used for normalization by fold change calculation. In this case, the expression results will be relative to the gene(s) used as reference(s). It can also be chosen to apply log2-transformation to the data (Figure 2). In this case, genes with an expression value that tends to infinity will be represented by 999.99.
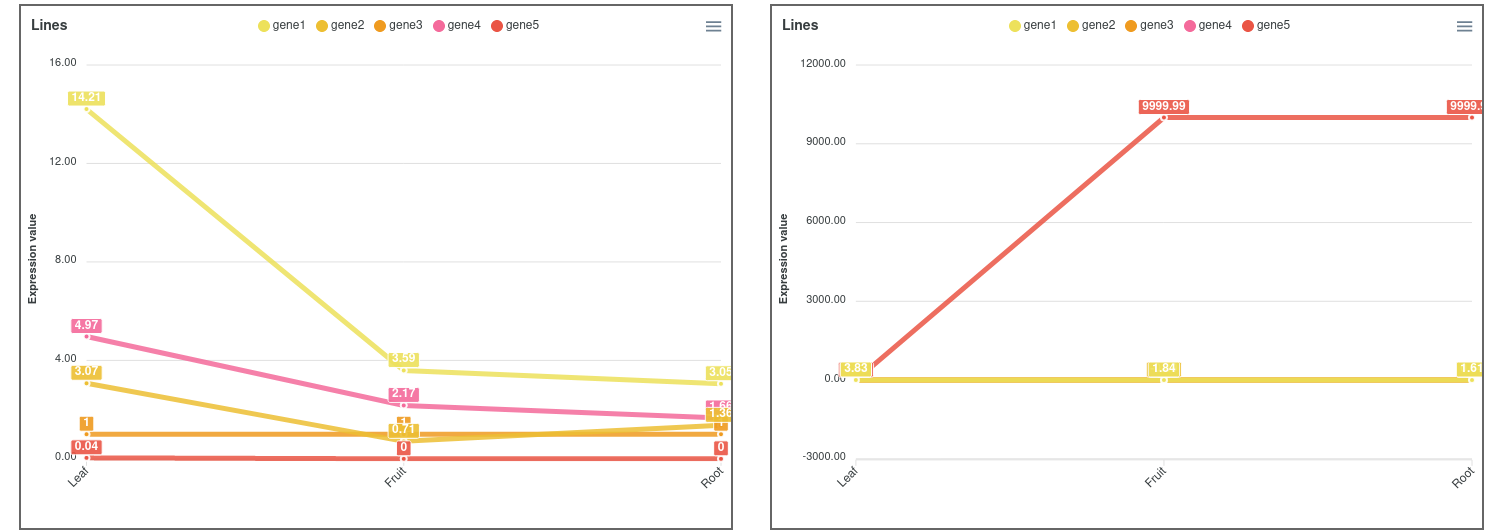
Figure 2. Expression comparator lines plot not applying log2 (left) and applying log2 (right).
In cases where the expression values and lines of some genes hide the information of others, it is possible to place the cursor over the gene names of the legend on top of the graph to highlight the selected gene. It is also possible to click on these gene names to show and hide the data in the graph (Figure 3). On the other hand, moving the cursor over the data points will show the values of all genes in the experimental sample selected. Additionally, the graph can be downloaded in different formats (SVG, CSV or PNG) to save an image of the plot or its data.
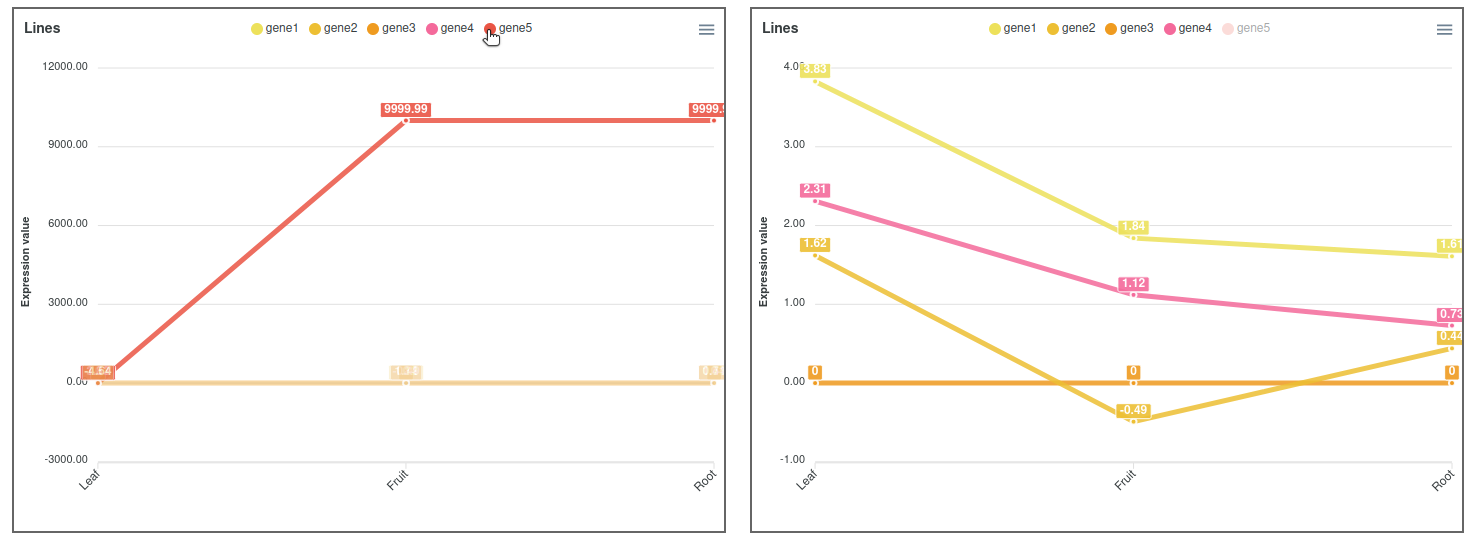
Figure 3. Expression comparator lines plot highlighting and hiding gene5.
Other visualizations tools include Heatmap, Replicates and Average values.
2.2 Without fold change calculation.
The user can choose not to specify a gene ID to be used for normalization. In this case, the visualization methods are the same but the expression values won't be referred to a gene.