QTL Search Page
The QTL/Trait search returns phenotypic traits that may have qtl data. QTL analysis is performed on the fly.
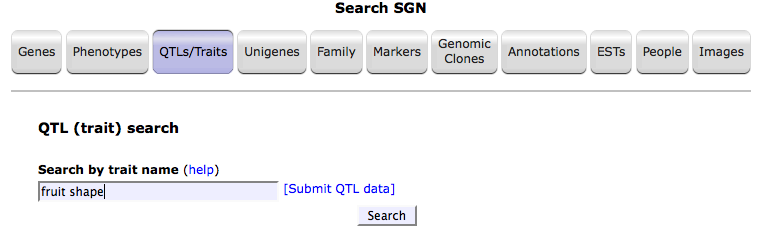
1. Search the database using a trait name. For example, 'fruit shape'.
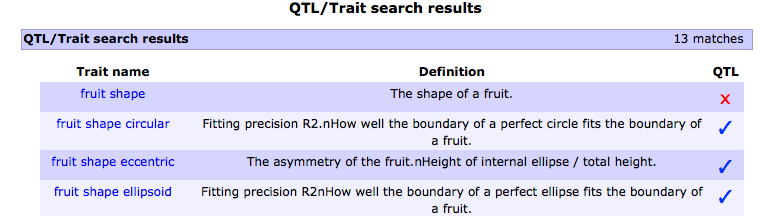
2. Follow the link for the trait of your interest.
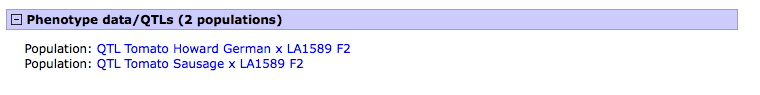
3. After selecting the trait of your interest, for example the trait 'fruit shape circular', you will be taken to the trait (cvterm) page, scroll down to the 'Phenotype data/QTL' subsection. Select the population of interest for which the trait was evaluated. For example, the population 'Howard German x LA1589'.
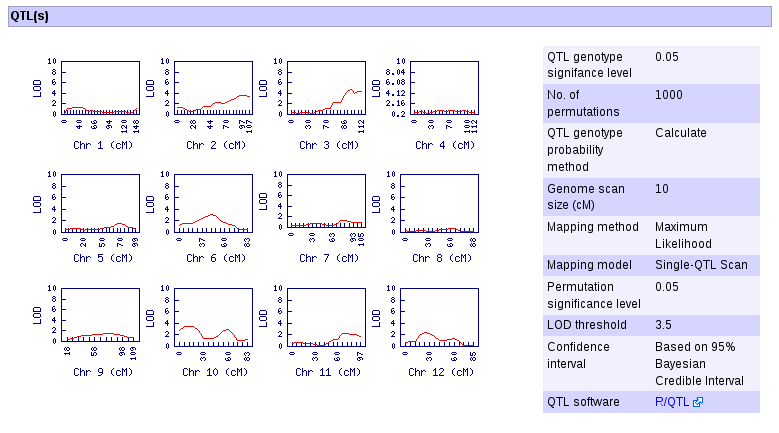
4. Visually determine which linkage group contains a QTL, see the LOD threshold in the legend. For example, chromosome 7 has a QTL. Click the linkage group of interest and on the new window, follow the link "Go to the QTL page...".
6. Clicking the "Go to the QTL page" generates the QTL detail page where among others the QTL confidence interval, links to the genome positions of the markers, marker detail pages, and SGN's Comparative Map Viewer are displayed.
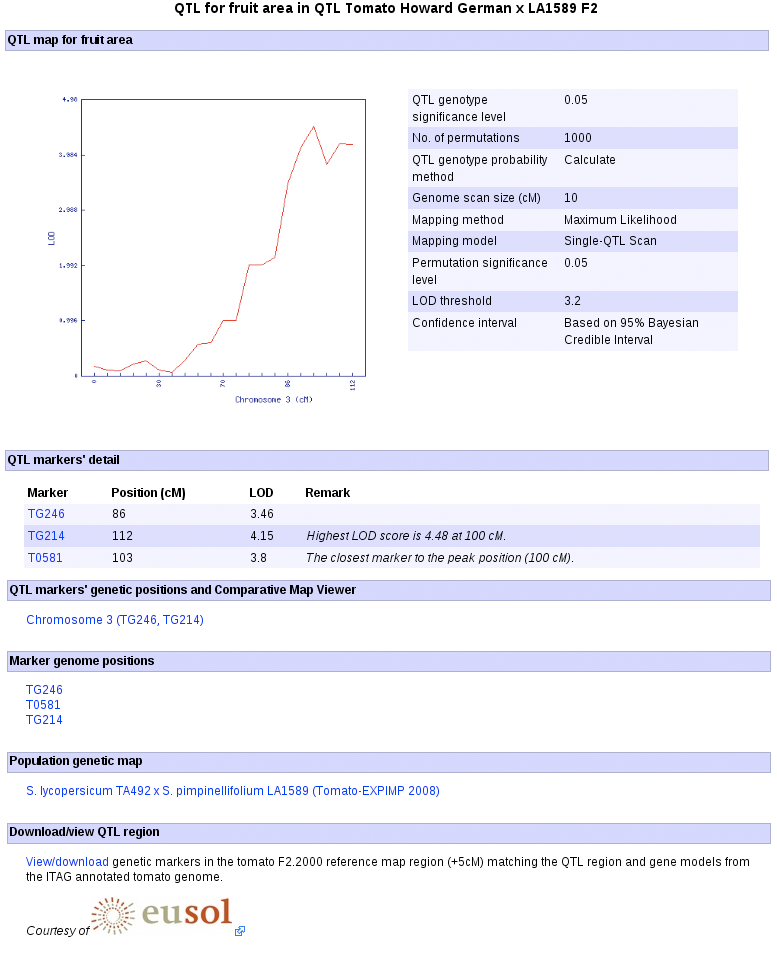
7. The QTL detail page (shown above) presents cross-references from the QTL to other relevant genetic and genomic data and bioinformatic tools. Forexample, to view the genetic location of the QTL of a trait of interest and compare it to other genetic maps using the Comparative Map Viewer, click the linkage group link under the 'QTL markers' genetic positions and Comparative Map Viewer' subection.
QTL genetic location:
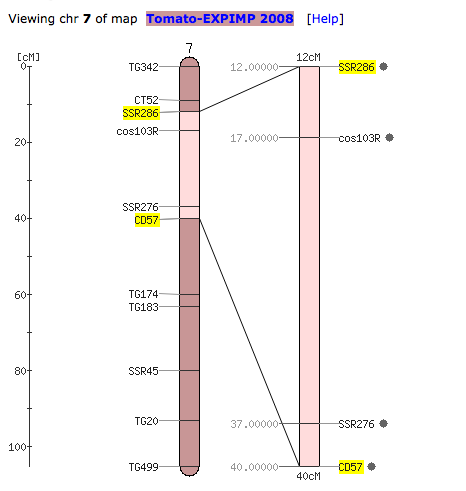
To learn on how to perform comparative analysis with genetic maps and physical maps of the same or different Solanaceae species, please read this help document.
If you have questions, please contact us at: sgn-feedback@solgenomics.net
Working
